Having reached this page we assume that you already know what you can do with DINAMIS, otherwise please revisit our home page . Having done so, the DINAMIS Guidelines is the next step to familiarize yourselves with some of DINAMIS’ basic concepts, assumptions and terminology.
How DINAMIS works?
Since everything is pre-configured, you only need to do one simple thing. Enter your data:
- Enter your network structure. We assume that it is in a hierarchical tree form, see below.
- Enter the products, services, activities or whatever is that you want to target and monitor. Group them if you like, because you most probably want to monitor the performance on a product group level.
- Enter the product credits, i.e. a figure the corresponds to each product’s revenue or profitability (see here for more information),
- Enter the product quotas for the current quarter
You need to do the above just once, or whenever something changes. Then, once per month, just import your monthly sales figures, with a very simple .csv file.
That’s it! You can now generate all DINAMIS reports.
You can easily modify or import new data, switch between years and months, create other networks, add or remove network nodes, and more, in a straightforward way. Everything is pre-configured so there’s no need for you to build or design anything.
Assumptions
Such simplicity comes with some assumptions, so please have a look at the following:
Network structure
- Dinamis assumes that your network structure has an hierarchical tree form as in the screenshot aside.
- The network can have as many hierarchy levels as required and each level can contain as many nodes as needed.
- In our example we have a Network Director, Divisions, Area Managers and Sales Reps, the latter being the lowest hierarchy level.
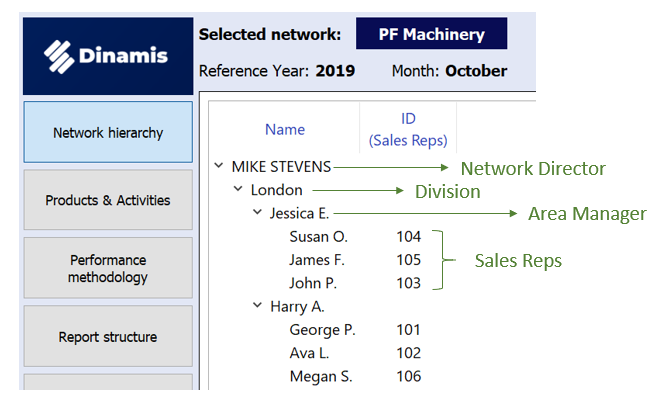
- The nodes of the lowest level are called sales nodes. Why is that? Because DINAMIS assumes that ONLY these nodes are actually your sales points (reps or stores). All higher levels are considered managerial in the sense that they do not have their own discrete quotas and sales figures, but these figures are just the aggregations of the sales nodes they manage. In the above example, the figures calculated for Jessica E., an Area Manager in London Division, are just the sum of the three Sales Reps under her supervision. Likewise, London’s figures are the sum of Jessica’s and Harry’s, and since Mike Stevens is the Network Director, his figures are those of the entire network.
- This is the why when defining your sales network, you have to enter a node ID, only for the sales nodes. When the time comes to import the figures into the internal database, DINAMIS must know what accounts to who.
Reporting
By the same reasoning, the Sales Reports generated for your network nodes, are identical to each other, i.e. you cannot have a distinct, from a design perspective that is, report for the Area Managers than for the Sales Reps.
However, it’s completely up to you whether you assign quotas for the same products to all of your sales nodes. So, in our example, maybe Jessica’s team has quotas for product A while Harry’s for product B. Their reports will look exactly the same, containing both A and B, but the overall performance will be calculated based on different product portfolios.
Performance Measurement methodology
It’s important to understand the way DINAMIS measures performance and there is page devoted in describing our methodology. We only mention here that this beta version of DINAMIS assumes that you have an annual budget but you set quotas per quarter and monitor the performance on a monthly basis.
Data Integrity & Synchronization
Handling data is effortless in DINAMIS. In the respective pages you can easily enter the network hierarchy, the products and the corresponding credits. Everything is saved the moment you change it, with the sole exception of the network hierarchy where you have the option to revert any changes you have made. The quotas and sales figures as well as any auxiliary data you want to appear in the sales reports can be imported and edited in the data management page.
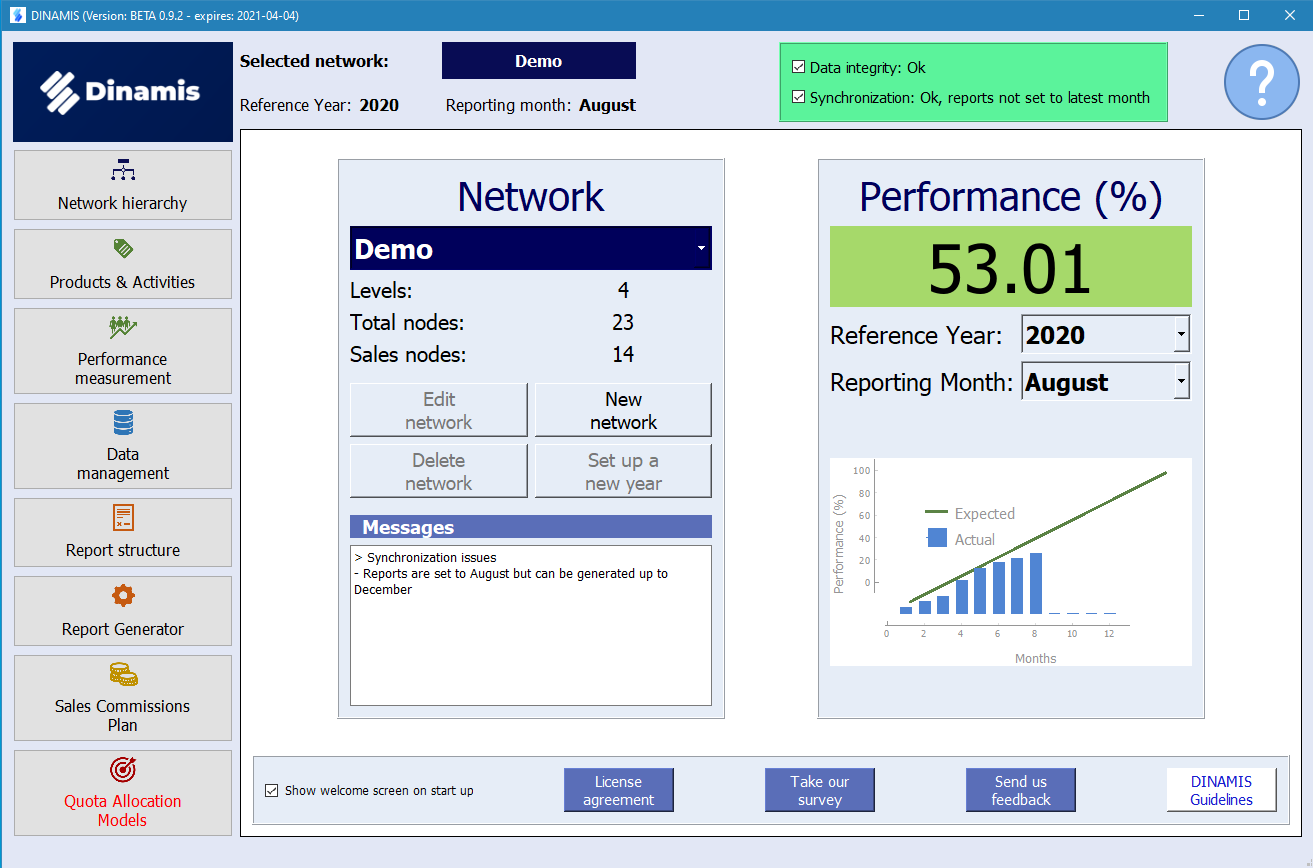
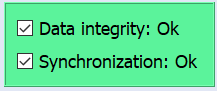
In the upper right side of the DINAMIS screen you can see at a glance the data integrity and synchronization status.
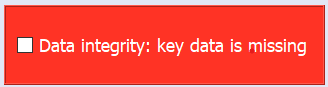
Integrity: Integrity refers to :
- whether some of the data required for the report generation is missing, e.g. you have not entered any products
- whether all of the data have been entered but there is some inconsistency between them, e.g. you have entered your products but none of the sales figures correspond to these products
If there is an integrity error, you will see a red frame.
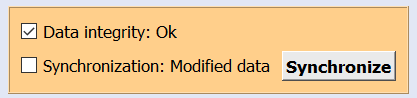
Synchronization: Every time you change something you will see a yellowish frame with a synchronize button stating that the data has been modified. Reports cannot be generated because the changes you have made have not been incorporated yet. When you are done with the changes, just press the synchronize button and if everything is ok, it will change to green, meaning that you can now generate the reports. The reporting month (i.e. the month the reports refer to) is automatically set to the latest one.
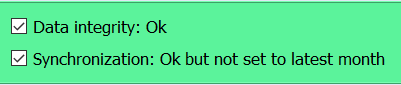
You can always change the reporting month in case you want to generate reports for a previous one. The frame remains green, meaning that every change has been incorporated, but it also warns you that the reporting month is not set to the latest one.
Note: The overview page always show more elaborate messages in case you need to be warned about something.