DINAMIS user’s manual contains instructions for each application page. To reach these instructions directly from within DINAMIS, you can always click on the question mark button.
Pages
1. Overview
2. Network hierarchy
3. Products & Activities
4. Performance measurement
5. Report structure
6. Report generator
7. Data management
8. Sales Commission Plan
9. Quota Allocation Models
1. Overview Page
The overview page gives you a brief look of your current network status and allows you to switch to another network or create a new one.
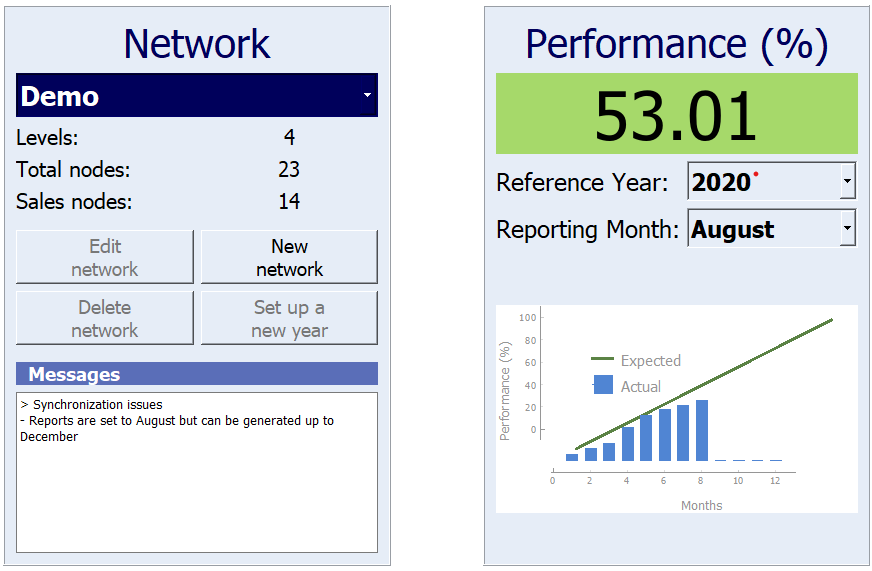
Information displayed
- Under the current network name you can see the number of hierarchy levels, the total number of network nodes as well as the total number of sales nodes (nodes of the lowest hierarchy level).
- On the top right side you can see the network’s overall performance, for the current reference year and the current reporting month. Underneath is the corresponding performance diagram.
- On the bottom left you can see useful information messages having to do with data integrity & synchronization issues.
Functions
New network
You can easily create a new network by pressing this button. The following form appears:
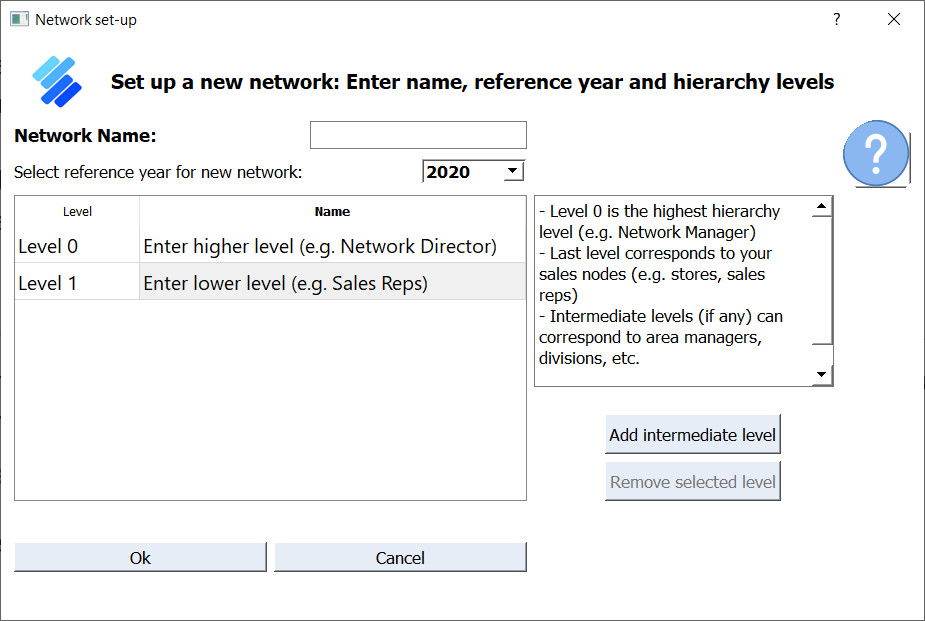
- First, enter a name for the new network.
- Second, select the year that initially this network refers to. Later on, you can add a new year from the overview page.
- Then, enter the network’s hierarchy levels. Keep in mind that a network consists of at least two hierarchy levels:
- Level 0 is the highest hierarchy level and only one node at this level can exist (e.g. Network Manager, Commercial Director)
- Last level corresponds to your sales nodes level (e.g. stores, sales reps).
- Intermediate levels (if any) correspond to intermediate levels of hierarchy (e.g. Divisions, Area Managers). Enter as many as necessary.
Edit network
The same form as above appears, where you can only modify the network’s name and the hierarchy’s level names. If you need a different number of hierarchy levels, then you must create a new network.
Delete network
You can delete the selected network (all of its reference years) by clicking this button. You will be asked to verify it first because this action cannot be undone.
Set up a new year
This function is not available in the beta version. You can only work on the year you initially created the network for.
Change reporting month
Regardless of up to which month you have entered your sales figures, you may select to set up your network to refer to a previous month. An occasion would be that you have entered updated past months’ figures and you want to generate a new set of reports.
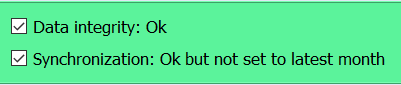
When you change the reporting month, everything is re-calculated as if the next months have never been entered. Just to be alert, in the synchronization banner, a message will appear:
2. Network hierarchy page
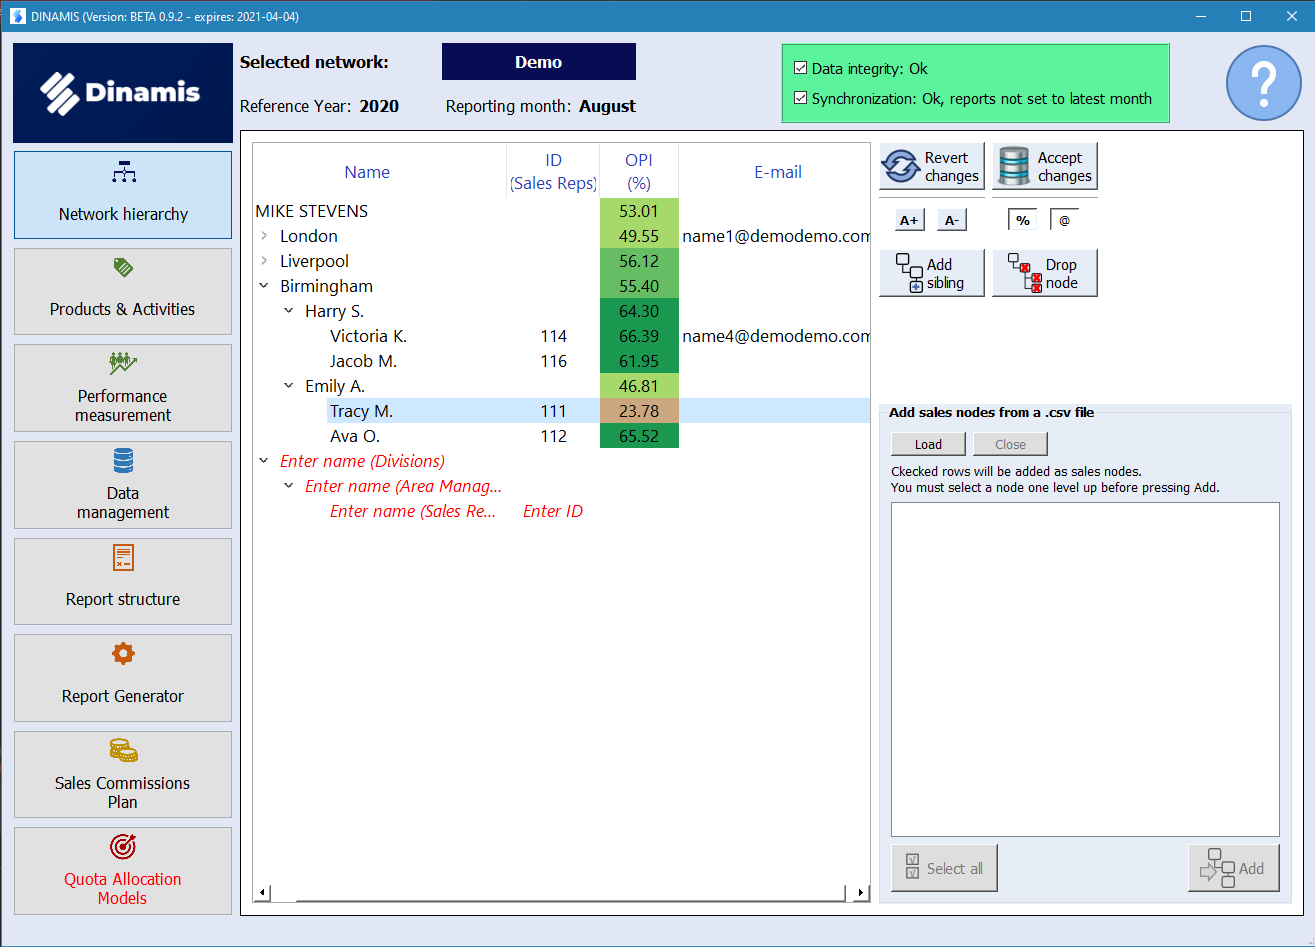
In the Network hierarchy page you can enter/modify the nodes of your network, in the hierarchy levels you defined when you created it.
Information displayed
In the main part of the page, the network structure is displayed in a hierarchical form. The ID column refers only to the lowest level sales nodes. The Overall Performance Indicator (OPI) column displays the current overall node performance. If missing, its probably that no sales or quota figures have been entered for the specific node ID.
Functions
Add sibling
To add a sibling node at the same level, just select an existing node and click Add Sibling. All levels will be instantiated (see the red italics in the screenshot above). Enter the names and for the lowest level (in our example, Sales Reps), you must also enter the IDs.
Note: You cannot have two siblings with the same name, in the same level. This is allowed only for the lowest level nodes (e.g. Sales Reps), but they must have a different ID.
Drop node
To drop a node, just select it and click Drop node. All child nodes will also be deleted.
Save changes
Changes you have made in the network hierarchy are not saved automatically, until you click this button.
Note: You cannot leave the page if you have made changes to the hierarchy and haven’t saved them. However, you can revert them by clicking Revert changes.
Revert changes
Reverts all pending changes and reloads the original network hierarchy.
Import sales nodes from a .csv file
If you want to import a large number of lowest level nodes, such as sales reps or stores, you can do so from a .csv file having only two columns (the node name and the sales node ID).
Note: DINAMIS does not check whether the .csv file is properly formatted, so please make sure that it is formatted as following (UTF-8, comma delimited and with no header line):
Name 1, ID 1
Name 2, ID 2
… , …
Press Load to open the .csv file and its contents are automatically displayed:
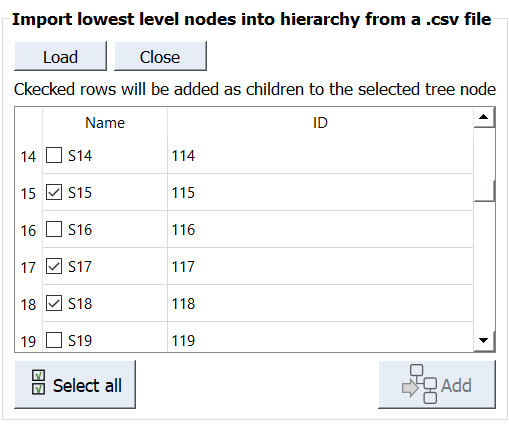
Select the nodes you want to import. For the Add button to be enabled, make sure to select the parent node in the network hierarchy, i.e. a node in the level above the lowest, otherwise DINAMIS will not know where exactly to import them. Repeat this for every parent node.
Minor functions
A+ & A- : Increase and decrease tree view font, both in this and the Report Generator pages.
%: Toggle the OPI column in the tree view
@: Toggle the email column in the tree view
3. Products & Activities page
This is where you enter the products that you want to target and monitor. By products we also to refer to activities, services or anything else that you want to target and monitor.
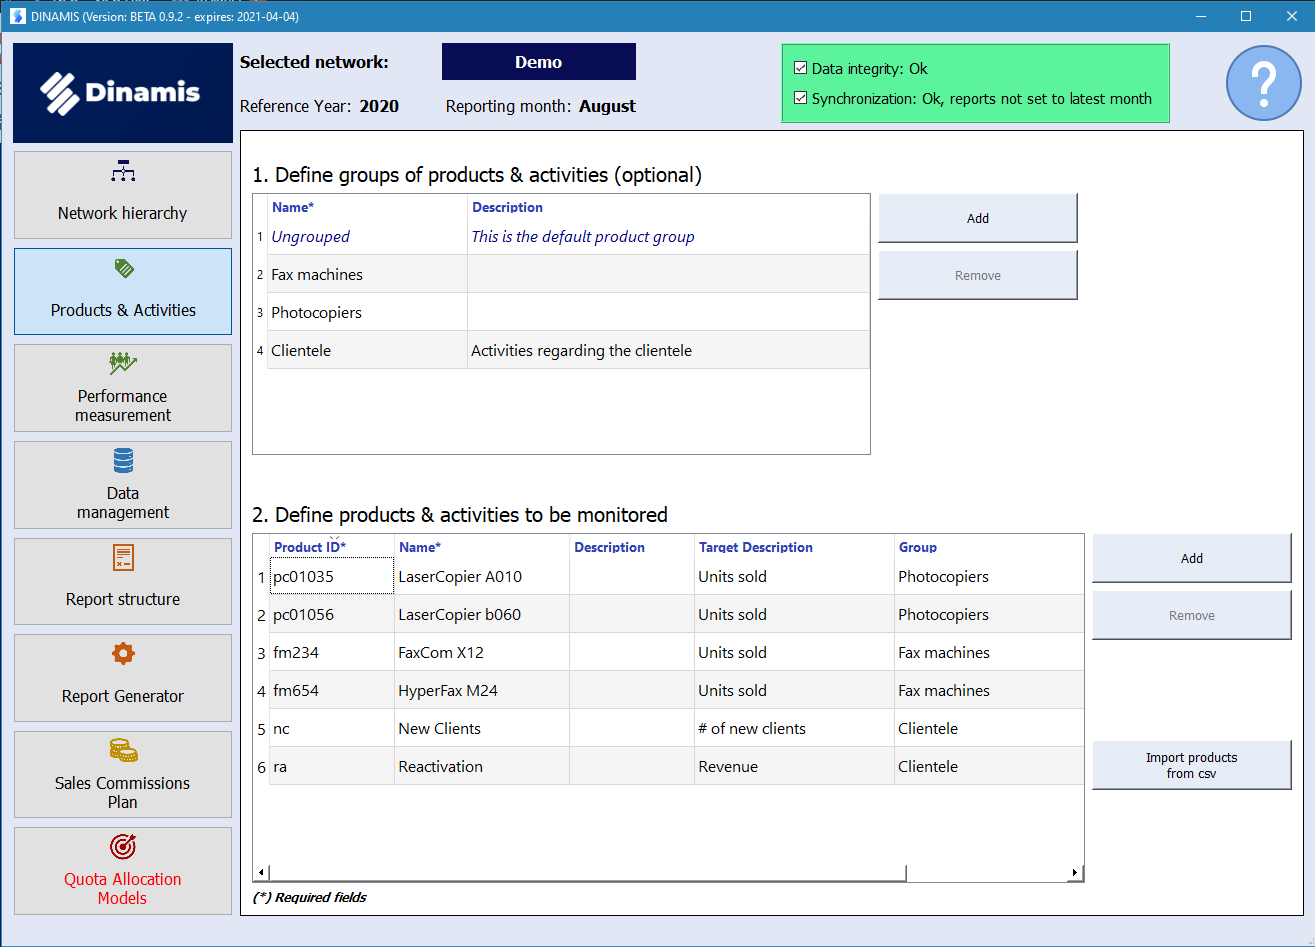
Product groups
You can optionally define product groups. We recommend that you do this if you have more than a few products to monitor. First, you will probably want to monitor the performance at a group level and second, for display reasons, you can choose to group the results at the sales report.
Products
Mandatory fields for products are the Product ID and the Name. The latter, as well as the target description (if declared) will appear in the sales reports.
Import sales nodes from a .csv file
If you have a lot of products you can import them with a simple .csv file containing all the five columns.
Note: DINAMIS does not check whether the .csv file is properly formatted, so please make sure that it is formatted as following (UTF-8, comma delimited and with no header line). The existing products will be deleted before importing.
4. Performance measurement page
Note: For an elaborate discussion on the performance methodology incorporated in DINAMIS, please read first here. The following assume that you are familiar with the subject.
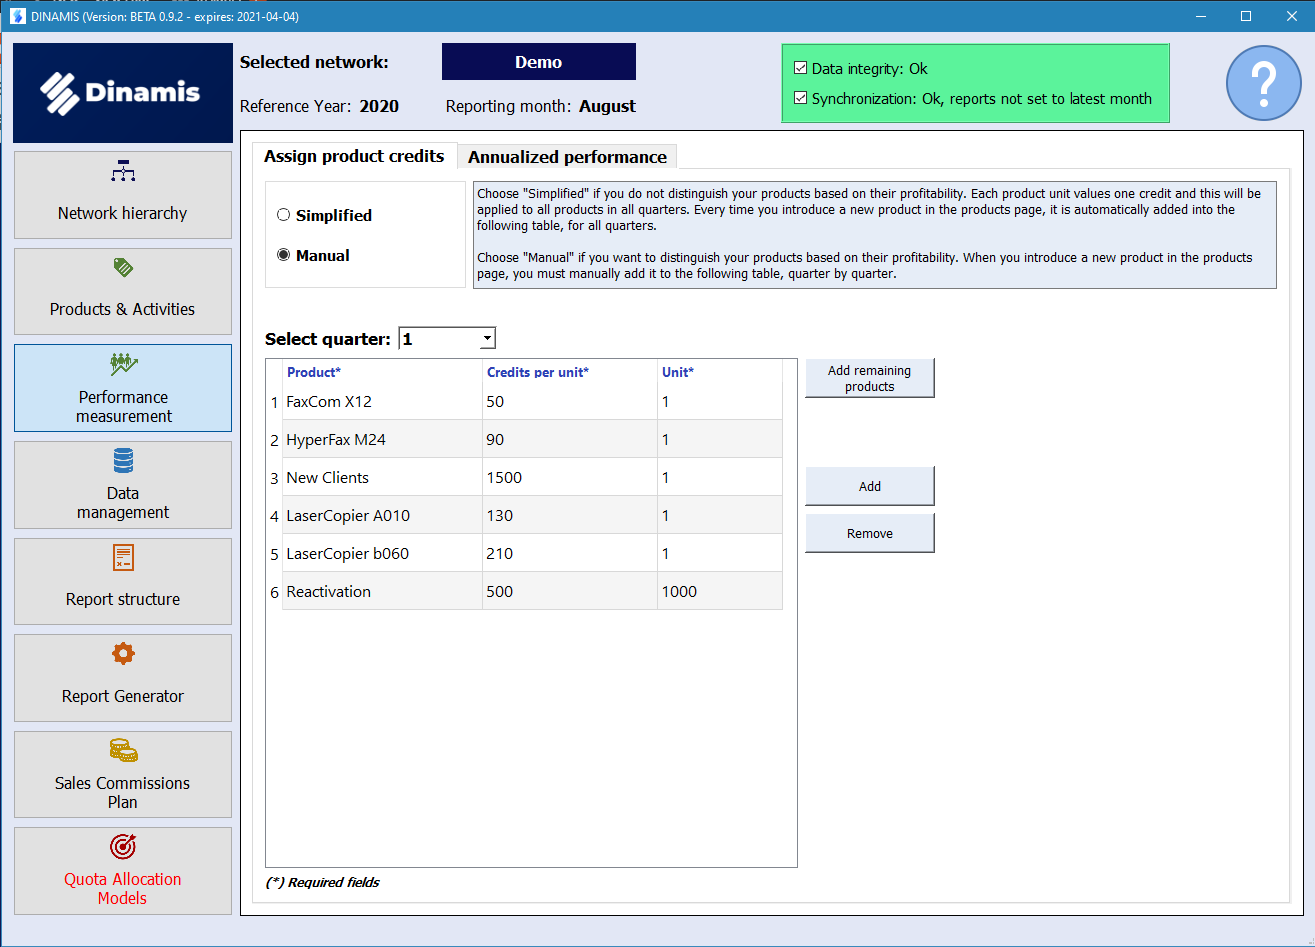
Assign product credits tab
Select simplified or manual mode
- Choose Simplified if you do not distinguish your products based on their profitability. Each product unit values one credit and this will be applied to all products in all quarters. Every time you introduce a new product in the products page, it is automatically added in the table, for all quarters.
- Choose Manual if you want to distinguish your products based on their profitability. When you introduce a new product in the products page, you must manually add it to the following table, quarter by quarter.
Select quarter
- Select the quarter you want to set credits for. If for a new quarter, DINAMIS will ask you whether you want to copy the products and credits of the previous one.
Enter products
- You don’t have to type in the product name, just double click on the cell and select it from the combo box.
- To automatically add all the remaining products, just click the corresponding button
- Note: If you do not set credits for a product for a specific quarter, it is as the product simply does not exist for this quarter. Even if quota and/or sales figures have been entered for this product, they will not count in the calculations.
Annualized performance tab
This beta version of DINAMIS assumes that you have an annual budget but you set quotas per quarter and monitor the performance on a monthly basis. In such cases, you usually disclose to your network the quotas, on a quarter by quarter basis. But then again, if the annual quotas are not known, how is the annual performance calculated? There are two ways:
- Use only the known quotas: If for e.g. we are in the first quarter and a sales rep achieves his/her quotas up to the point at the end of this quarter, the performance will be 100%. But in April, when the quotas for the second quarter will have been disclosed, immediately this performance drops, since we now have semester quotas but only 1st quarter sales. If the sales rep still has the expected pace in the 2nd quarter, he/she will reach again 100% by the end of June. So, the expected annual performance on each month is calculated by the formula 100*month/(quarter*3) as in the following diagram:
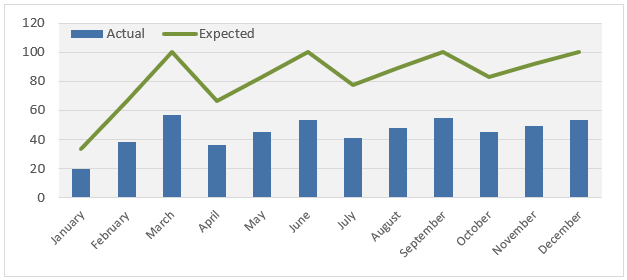
- Use the annualized performance: If you are ok with the annual performance fluctuating within quarters, then the above is just fine. However, if you want it to gradually increase from 0 to 100 within the entire year, which you probably do, then we strongly suggest to use the annualized performance, where DINAMIS multiplies the performance with the factor quarter/4. So for e.g., by the end of the 1st quarter the actual performance for the sales rep having achieved the 100% of his/her quotas will be 25%, and so on, as in the following diagram:
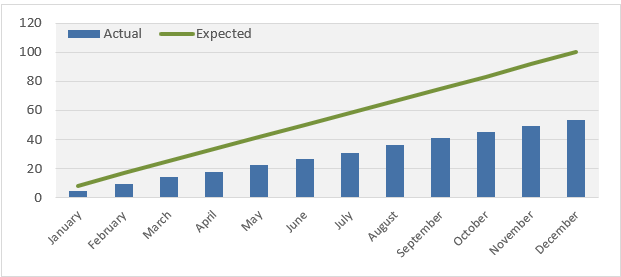
- Note: This approach actually implies that the quotas for the remaining quarters will be proportional to the previous ones, which of course is not always the case, but it gives your salespeople a more “expected” indication of how their performance evolves within the year. Whichever approach you choose, at the end of the year, the results will be exactly the same.
5. Report structure page
Dinamis generates three reports, namely the Sales report, for each one of your network nodes, the Management report and the Sales Commission Plan report.
These reports are pre-designed, however you can choose whether some of their components will be displayed or not.
Sales report
Main sheet tab
Note: For details on the Sales report structure, please have a lookhere.
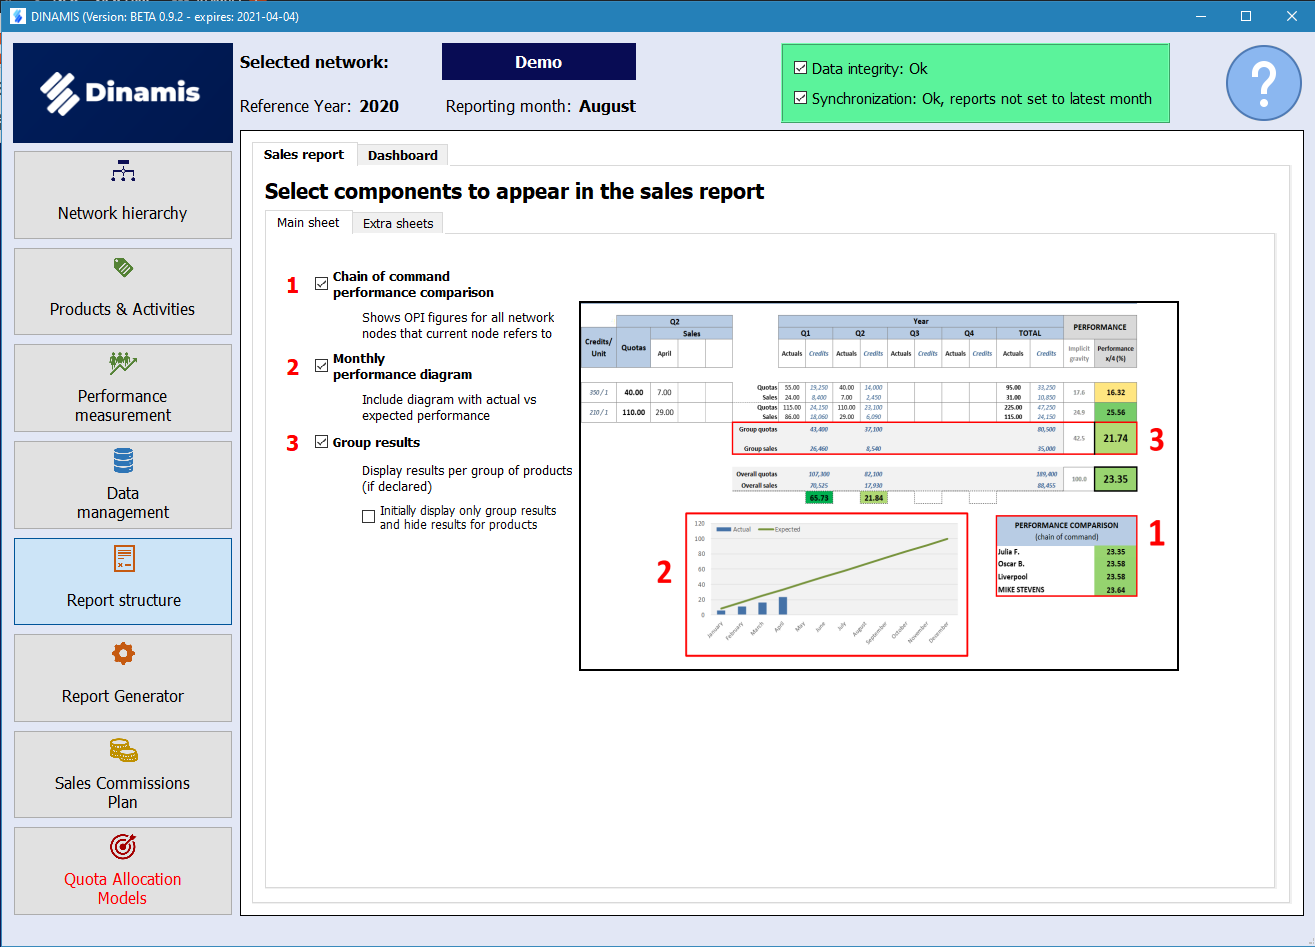
- Chain of command performance comparison: Shows Overall Performance Indicator figures for all levels of hierarchy where the current node refers to
- Monthly performance diagram: Includes a diagram with actual vs expected performance
- Group results: If you have declared groups of products. check this option if you want group results as well to be included in the sales report
- Optionally, if you have a very large number of products, you may choose to initially hide the product rows in the sales report.
Extra sheets tab
Select the Sales report tab and within, the extra sheets tab:
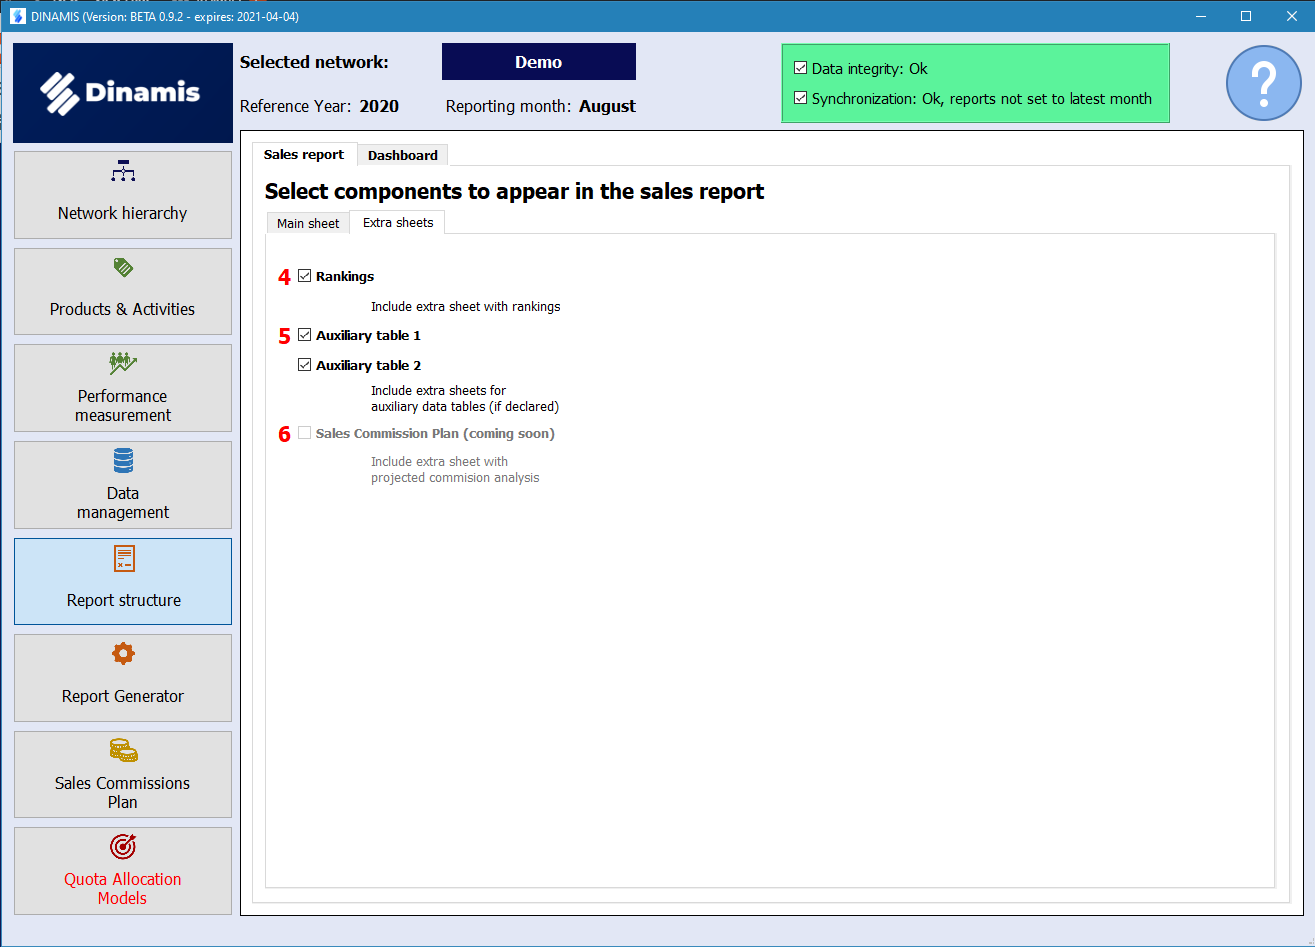
4. Rankings: Includes an extra sheet with rankings, for all levels of hierarchy
5. Auxiliary tables: Provided that have entered auxiliary data in the Data Management page, check if you want this data to be displayed as extra sheets in the Sales report.
6. Sales Commission Plan (coming soon): Includes an extra sheet with details on the current commission calculation for the specific node.
Management report
- Include distributions of sales nodes (histograms): Check if you want the two histograms to be displayed (recommended for networks with a large number of sales nodes)
- Default number of histogram bins: Select the initial number of bins, between 2 and 10. When the report opens, you can always change the bins number from that the bar underneath the histograms.
6. Report generator page
From this page you can generate your Sales and Management Dashboard reports. For details on what these reports contain, please have a lookhere.
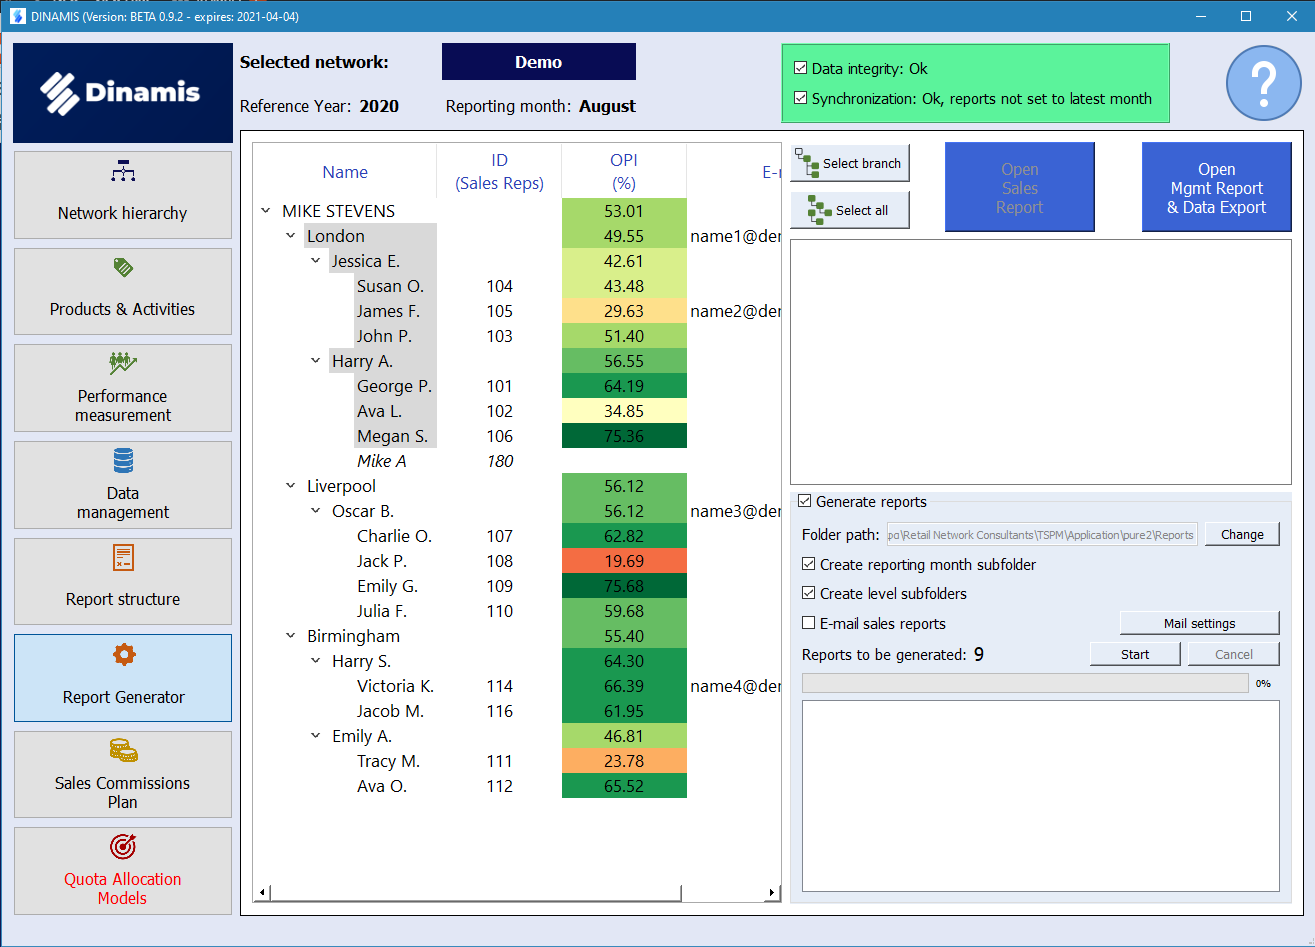
Information displayed
In the main part of the page, the network structure is displayed in a hierarchical form, exactly as in the Network hierarchy page.
Functions
Open a single Sales report
Just select a node from the tree and press the Open Sales Report button.
- Note: Only nodes for which an OPI figure exists can be opened. A missing OPI figure is probably due to lack of quotas and/or sales figures for the specific node and is shown in italics (see Mike A. in the above screenshot).
Generate reports
Check this option if you want to save one or more reports, without opening them.
- Select a node from the treeview. If you also want to select its children, click Select branch. If you want to save the reports for all the network nodes, just click Select all. You usually do so when you are ready to generate the monthly results.
- In any case you can see the number of reports that will be generated in the bottom right part of the page.
- Select the folder where that reports will be saved. A subfolder will be created with the network’s name.
- Create reference month subfolder: Check this if you want to create a subfolder for the year and month that the reports refer to. By doing so you can have a different subfolder for every month. The subfolder’s name will be in the form year_month.
- Create level subfolders: Check this if you want a subfolder to be created for every network node that reports are generated for, excluding those in the lowest level. By doing so, every node will have its own separate folder. In our example, the following subfolders will be created:
- MIKE STEVENS
- London
- Jessica E. (The Jessica E. folder will also contain the sales reports for Susan O., James F. and John P.)
- Harry A. (The Harry A. folder will also contain the sales reports for George P., Ava L. and Megan S.)
- London
- MIKE STEVENS
- You can combine the above two options to create the folder structure that suits you the most. If you deselect both, all the reports will be saved in the network’s directory. This is not a problem at all, you can always select what you want based on the filenames, which follow the form: year_month_node level_node name_[(node_ID)], where the (node_ID) exists only for the lowest level nodes.
- Press the Save button and the report generation begins. You can always cancel the process by pressing the Cancel button.
- If you also want to automatically email the sales reports you can also check E-mail sales reports. Make sure that beforehand you have set up properly the Mail Settings.
Open the Management report
Press the Open Mgmt Report & Data Export and generate the Management report which includes a data export as an extra sheet
7. Data Management page
From this page you can handle (import/enter/modify) the quotas, sales and auxiliary data used by DINAMIS.
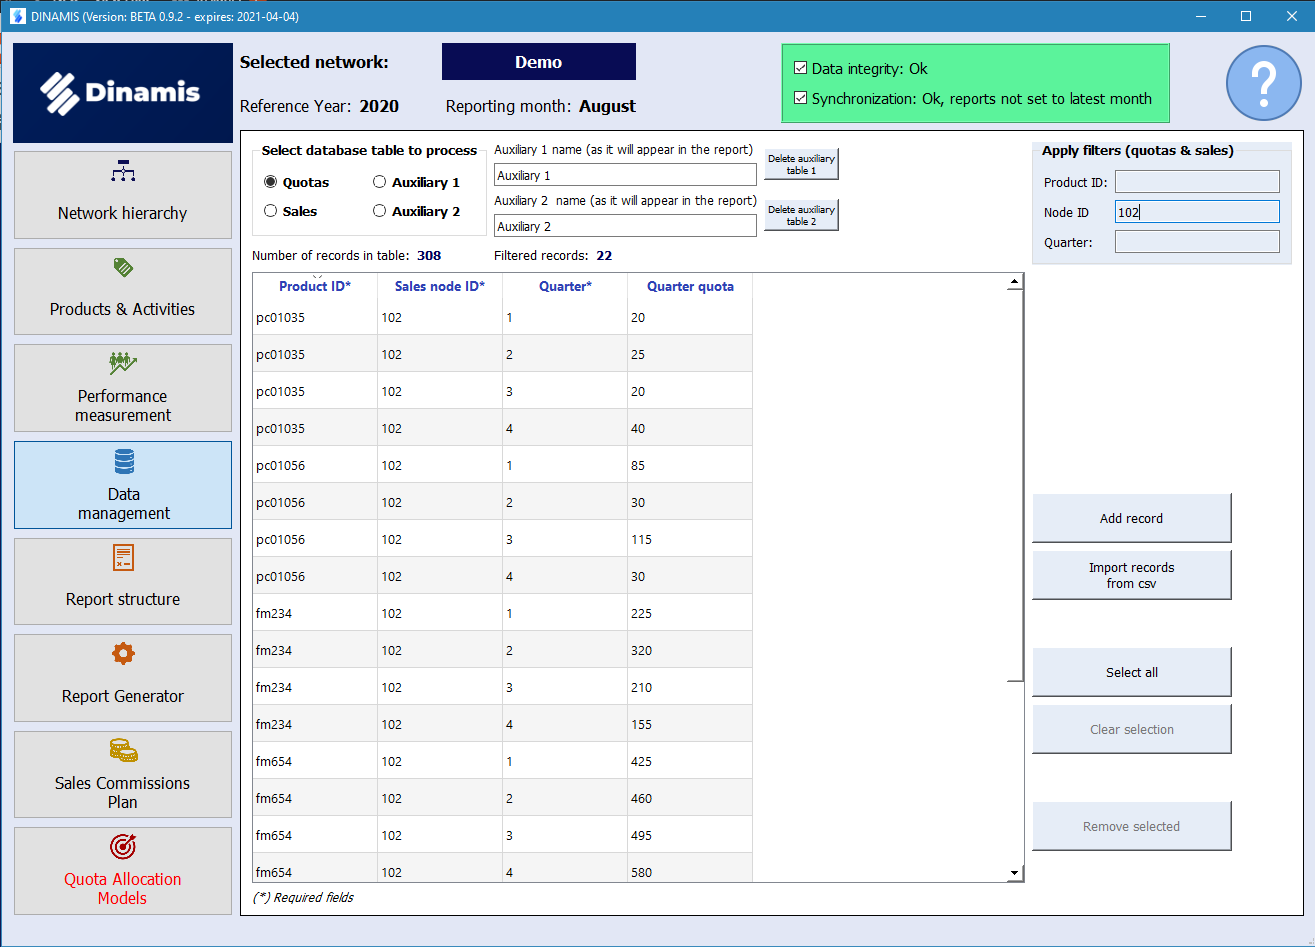
- Select database table to process: Select a table and its records are automatically displayed. You can add and remove records that instantly update the internal database. You can filter the records by product ID, node ID and quarter or month, the latter for the quotas and sales figures respectively.
- Auxiliary tables: The two auxiliary tables hold the information that you want to share with your network. The first time you choose an auxiliary table you will be asked to select the .csv containing its record. Please note the following:
- The first row will be used as column names
- The first column must contain the IDs of the lowest level nodes, usually stores or sales reps. DINAMIS will import all rows without checking whether they match with existing network nodes.
- You can enter a name for the table. The sheet that will be added in the sales report will be named as such. You can always delete an auxiliary table by pressing the corresponding button.
8. Sales Commission Plan page
Note: For an elaborate discussion on the Sales Commission Plan incorporated in DINAMIS, please read first here. The following assume that you are familiar with the subject.
Network & Level Commissions tab
In this tab you set up the parameters that calculate the commission for the entire network and its allocation to the network levels.
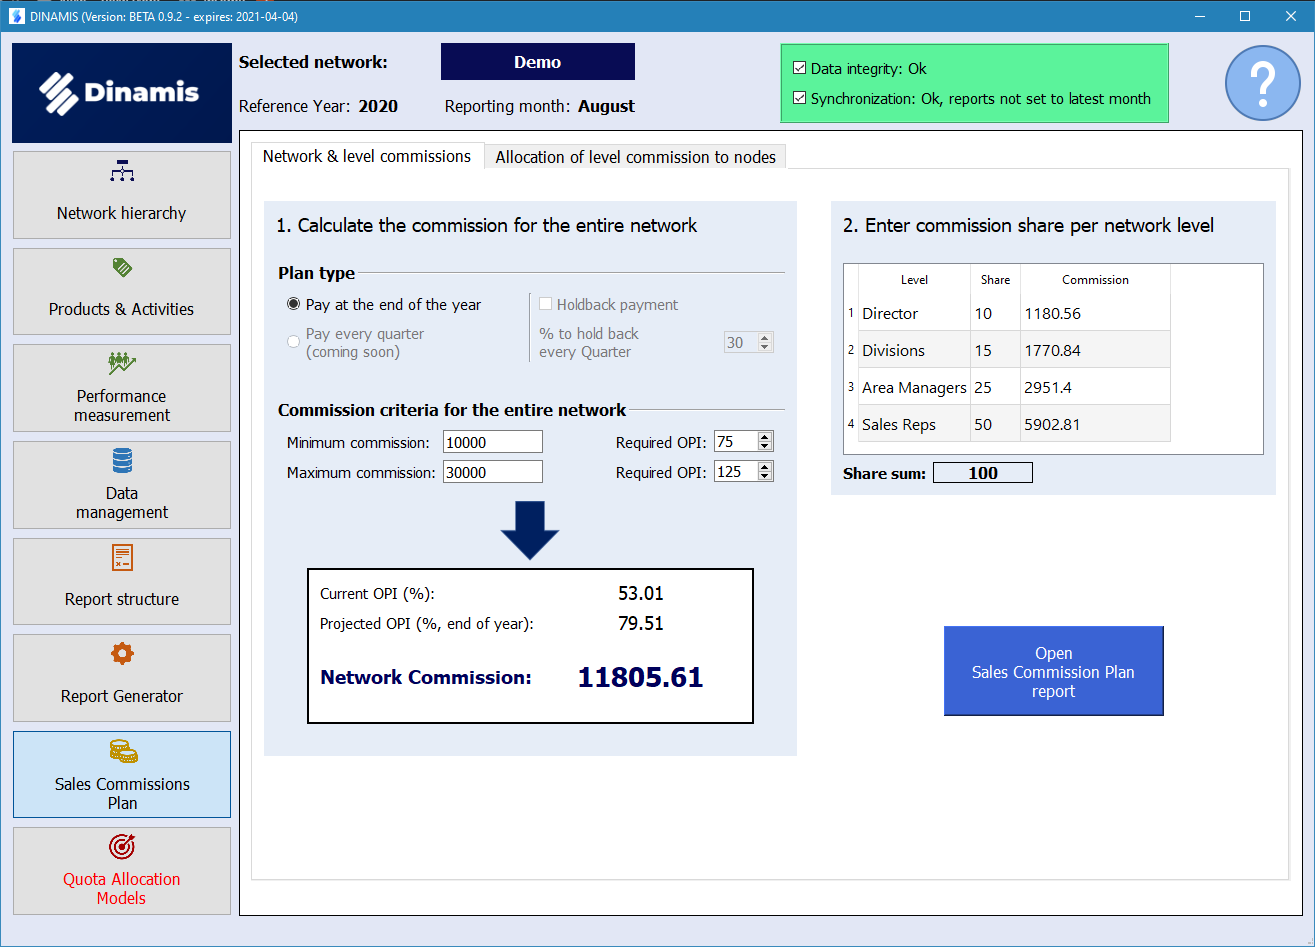
- Plan type: Initially you select the plan type, namely whether commission is due to be paid at the end of the year or on a quarterly basis. Currently, the beta version only supports the end of the year plan.
- Commission criteria for the entire network: Enter the minimum commission that can be allocated to the entire network as well at the minimum OPI that must be attained for that to happen. Also enter the maximum commission, and again, the corresponding minimum OPI.
- Network commission: The network commission Is automatically re-calculated when you change any of the above parameters
- Commission share per network level: Having calculated the network commission, you must set its share for each network level. The share sum must of course add to 100.
Open SCP report: The SCP report button shows up here just for convenience. Normally, you must first set up the parameters for allocating the commissions per level, on the next tab.
Allocation of level commissions to nodes tab
In this tab you set up the parameters that determine the allocation of a level commission (calculated above) to its nodes.
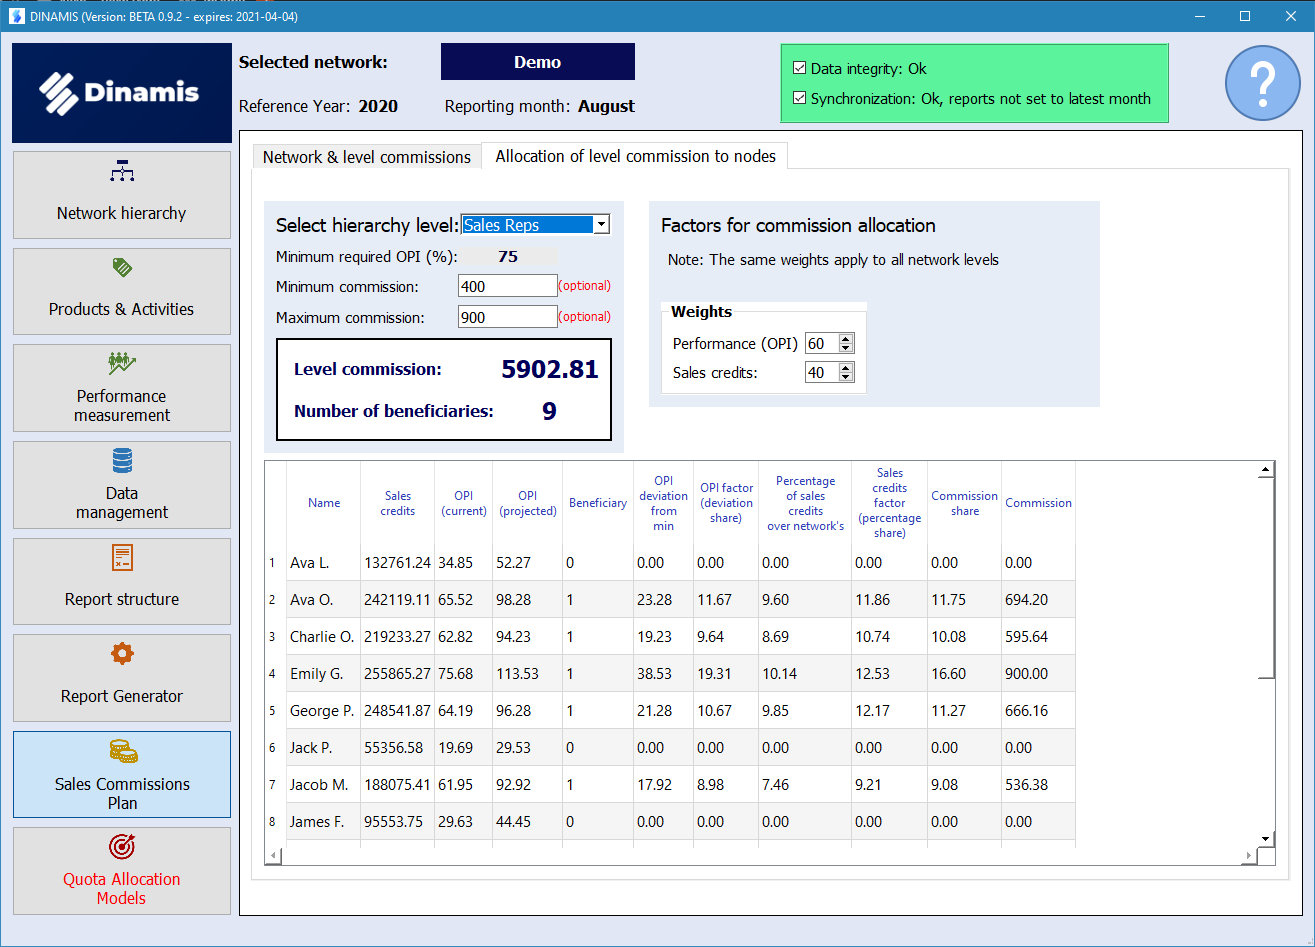
- Select the network level you want to parameterize
- You can optionally define the minimum and maximum commissions a level node can be awarded with
- Set up the OPI & Sales Credits factor weights for commission calculation. Please note that the weights are the same for all the network levels.
- Changing any of the above parameters, automatically re-allocates the level commission to the level nodes.
9. Quota Allocation Models
(coming soon)