You probably set quotas for more than one product, so you need a way to combine the performance on individual products into a single performance indicator, to get an idea of how your sales nodes are performing, overall.
Our performance measurement methodology results in an Overall Performance Indicator which is DINAMIS’s key figure of merit that does just that. However, before describing how it is calculated we need to sort a few things out, starting with an important question:
Assuming you have the option, a question to ask yourselves is whether you should set:
A. Annual quotas that will obviously result in an annual performance
B. Annual quotas, split and communicated in quarters* that will also result in an annual performance
C. Quarter* quotas with quarter* performance, but no annual performance
(*) Same apply for monthly quotas
A.
- Solution A is the simplest choice where you set quotas just once, at the beginning of the year, but depending on how a sales node is performing during this period, this may result in a lower incentive on maximizing its sales, in cases of over(under)performing. Therefore, it is a choice only to start with.
B.
- Solution B is a variation where you set quotas for all quarters at the beginning of the year, also considering seasonality issues, yet you reveal them on a quarter basis. This gives you a small margin for quarterly minor–adjustments based on each node’s performance. The latter, as with Solution A in calculated on a Year to Date basis.
C.
- The previous choices are valid when the management wishes to evaluate performance over previous year figures and Solution B is the one that most companies use.
Solution C on the other hand is a most aggressive approach, being the case where each quarter is a separate targeting period. You run your Quota Allocation Models at the beginning of each quarter, you calculate nodes’ performance, pay your staff (if you use a sales commission plan) and move on to the next quarter. You simply do not calculate an annual performance.
Regardless of your choice, you need to combine the performance on individual products and define an Overall Performance Indicator. There are two ways to accomplish this, either using product weights or product credits:
Product weights
Consider an example where you want to target three products/activities for the first quarter, as in the following table:
|
Product/ |
Target |
Quotas |
Result |
Performance |
Product |
|
Clients |
New |
100 |
80 |
80% |
20 |
|
Product_x |
Units |
2,000 |
2,500 |
125% |
30 |
|
Calls |
Completed |
500 |
300 |
60% |
50 |
|
100 |
The quarter Overall Performance Indicator is simply the weighted average of the product performances:
OPI = 80%∗20 + 125%∗30 + 60%∗50= 83.5%
Although the calculation is a straightforward one and easily understood by everyone there are a couple of drawbacks for you to consider:
- The same weights apply to all network nodes. This is not ideal, especially if due to seasonality or clientele issues, some of your sales nodes end up with small quotas but with large weights.
- If you use Solution B, then you will most likely have a distinct set of product weights for each quarter, but you need to calculate performance in a YTD basis. There are various ways to do so, one would be to end up with a YTD set of weights, by defining a weighted average of the quarter weights (see example below). You do insert however, an extra level of complexity.
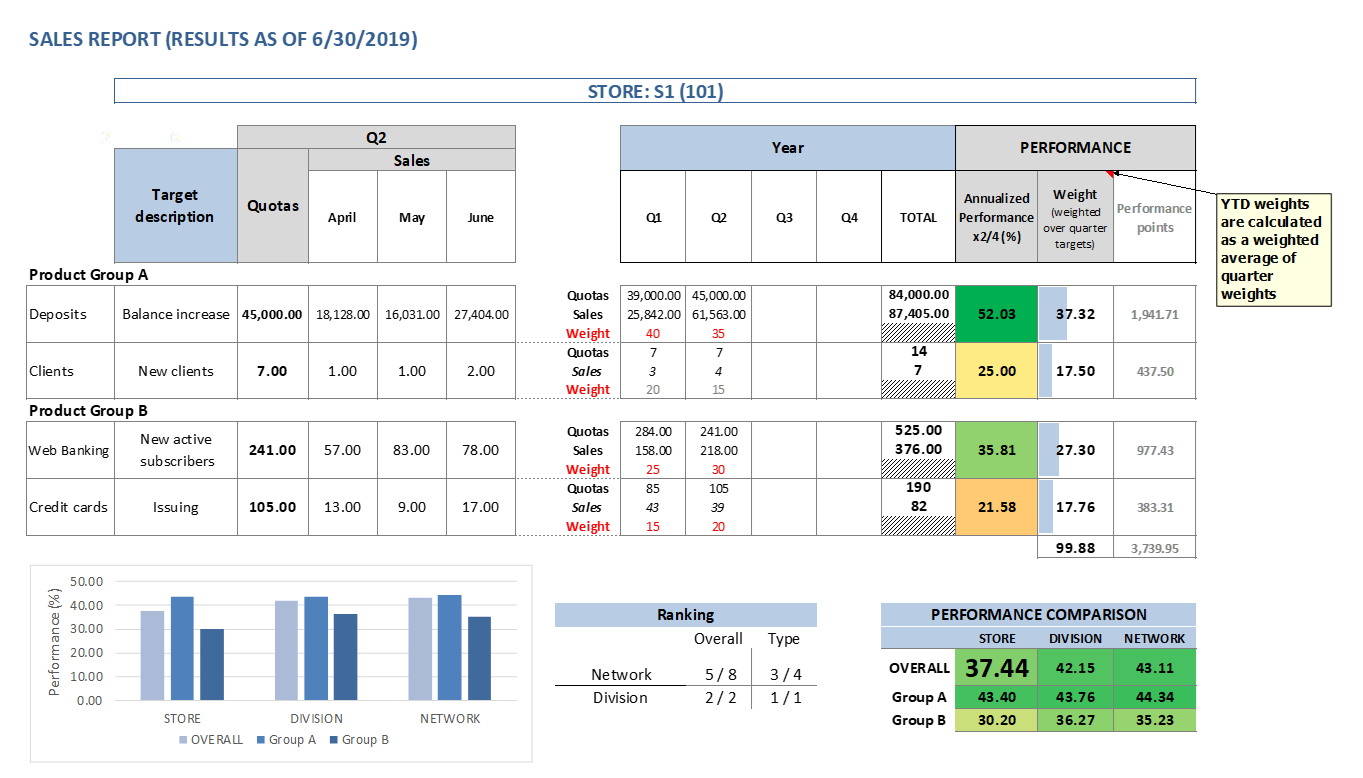
Fig 1. Example of Solution B using a discrete set of weights per Quarter and a weighted average for YTD calculations.
From weights to credits
- Weights reflect your company’s strategy for the specific targeting period. Each product weight should approach the expected share of the product’s expected revenue in the total expected revenue of all targeted products.
- The weights are the same for all the sales nodes, assuming that the difficulty for achieving the quotas is the same for everyone.
- Albeit true, a consequence is to have certain nodes that due to several reasons must be set to small quotas for a specific product and quarter, while at the same time, these quotas are accompanied by a large weight. If a node achieves this quota, the impact on its overall performance is high, but its expected revenue is rather small. If is falls short, the incidence on its performance is disproportionately large.
- On the contrary, these nodes should probably be set to larger weights, for other products in the specific quarter.
- Therefore, what we are looking for, is to differentiate the weights per node, based on the expected revenue of each product in respect to the total expected revenue of all targeted products, for this node.
Sounds extremely complex, but it’s much simpler than you think!
Product Credits
As mentioned before, you set the product weights in a way that correlate with the expected revenue of each product in respect to the total revenue, or net profit for that matter. But you can do that in a more direct way, by converting product quotas, from their unit of measurement into credits. You simply assign a number of credits to every unit of that product. Better show this through an example:
Weights to Credits Example
- Consider two bank branches A and B, of equal size, A located in an urban area and B located in a summer touristic area, with high seasonality. Also consider 1st quarter quotas for only two products (increase in deposits balance and number of new POS contracts).
- Due to seasonality, branch B in the summer touristic area receives for the 1st quarter a small quota in deposits increase compared to the equal sized branch A, and a bigger one regarding the POS contracts.
- We assign, a number of credits to each new POS sale or balance increase, the credits related to the expected revenue.
- This way, the discrete in their nature quotas are expressed in the same manner, becoming comparable.
- The implicit product weight equals the ratio of the product credits to the overall credits, for that Branch.
|
1st Quarter quotas |
Branch A |
Branch B |
|
Deposits increase (in $) |
500,000 |
250,000 |
|
In credits: 20 per 1, 000$ increase |
10,000 |
5,000 |
|
New POS contracts |
50 |
90 |
|
In credits: 80 per new contract |
4,000 |
7,200 |
|
CREDITS TOTAL |
14,000 |
12,200 |
- Branch A receives an overall bigger quota (14,000 credits) for the 1st Quarter than the equally sized Branch B. because it has a bigger quota for the deposits, which is the main target (15,000 credits for both branches).
- However, the implicit weight of POS contracts for Branch B is higher (59%) that the one for the deposits (41%), as desired, because this is where the highest revenue is expected from, for that Branch.
- As you can see, the two Branches are set to a distinct set of weights for the same quarter.
- A reversed situation is expected to take place at 3rd Quarter.
- In Fig. 1, in order to calculate a YTD set of product weights, we had to improvise by defining a weighted average of the quarter weights. This is simply not required any more, since all quotas and sales figures are expressed in credits. For YTD calculations we just add the quarter figures (see how the example is transformed in the Fig. 2).
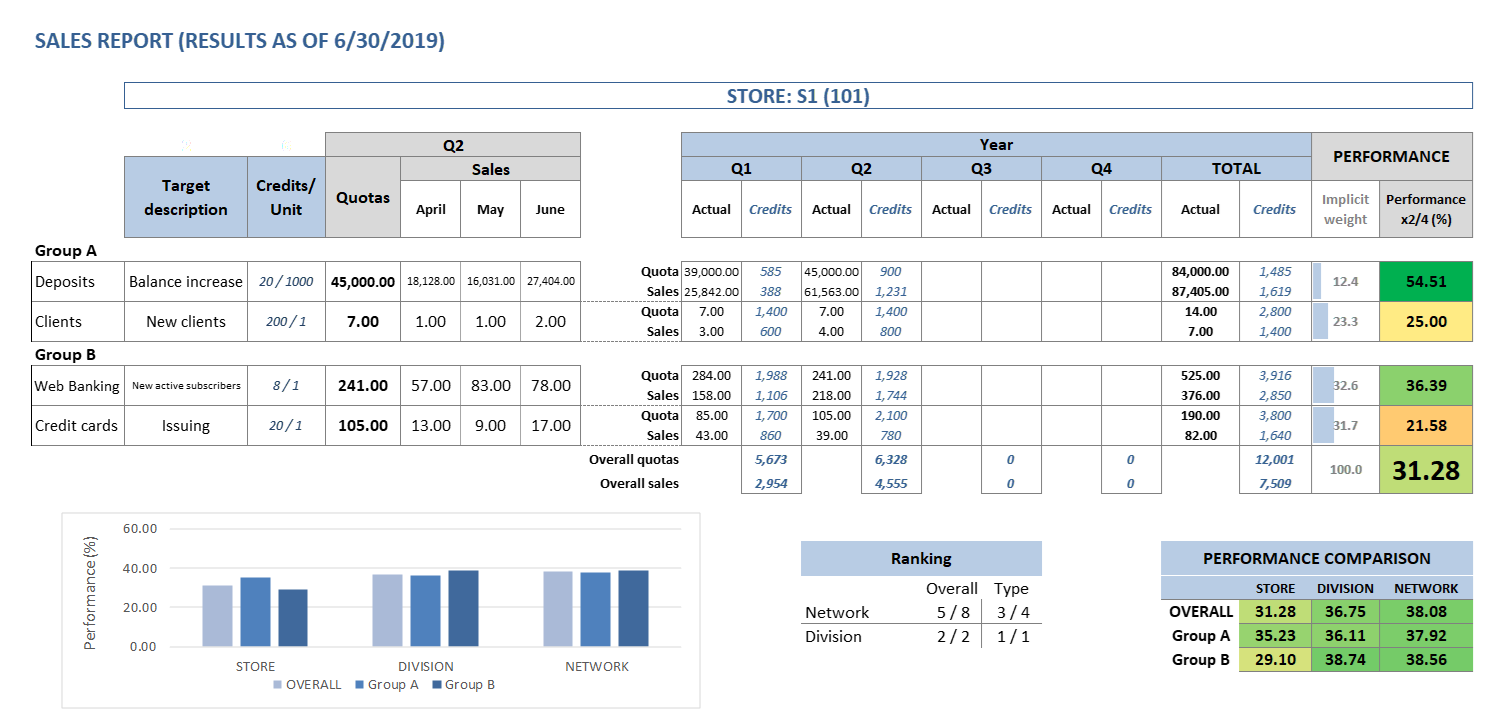
Fig 2. Same example as in Fig.1 using credits instead of weights. The implicit weights are displayed just for informative reasons.
Credits: Basic principles
You may ask why we use the term “credits” instead of referring directly to revenue or net profit. Well, the credits are of a more generic nature and give you the flexibility to include other parameters when setting them. In principle, credits are related to:
- Your company’s strategy for the targeted period
- The expected revenue or net profit per product
- The promotion difficulty of each product
So, you may decide when launching a new product to reward your people with extra credits than those based solely on the expected net profit, just because you want to promote its sales. Eventually however, the revenue/net profit should be the main driver, so that the overall performance is truly related to the total revenue.
As mentioned before, the credits approach corresponds to discrete weights per sales node:
The product weight equals to the ratio of the product quota (in credits) to the sum of product quotas (in credits).
The store’s overall performance equals to:
The ratio of the sum of all product sales (in credits) to the sum of product quotas (in credits).
Extra benefits of using credits
- Sales nodes can be ranked by their overall quota, in credits. You simply cannot do this by using weights.
- It is pretty straightforward to add extra products or sales rallies during a targeting period.
- Important: You can easily, and you should, “transform” your sales nodes individual performances into sales commissions. See our Sales Commission Plan page for more information.